
3D Eclipse Breast_L Planning
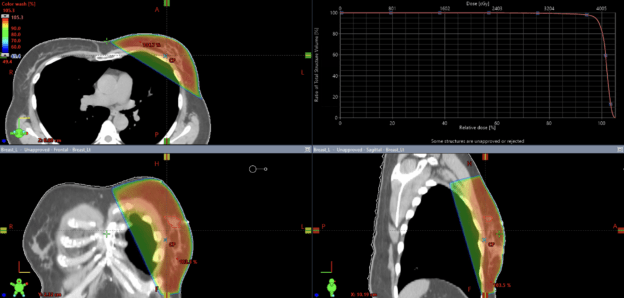
This course offers an in-depth exploration of the radiation treatment planning process tailored for breast radiotherapy. We will leverage advanced 3D conformal planning techniques, focusing on the precise configuration of tangential field arrangements and the integration of field-in-field (FiF) planning to enhance dose uniformity. The curriculum will systematically address the core principles of treatment planning, providing a detailed walk through of their application. Furthermore, we will rigorously evaluate the resulting dose distribution to assess the plan’s effectiveness and dosimetric quality.
This course offers an in-depth exploration of the radiation treatment planning process tailored for breast radiotherapy. We will leverage advanced 3D conformal planning techniques, focusing on the precise configuration of tangential field arrangements and the integration of field-in-field (FiF) planning to enhance dose uniformity. The curriculum will systematically address the core principles of treatment planning, providing a detailed walkthrough of their application. Furthermore, we will rigorously evaluate the resulting dose distribution to assess the plan’s effectiveness and dosimetric quality.
Course Content
About Instructor

Course Includes
- 1 Lesson
- 8 Topics
- Course Certificate